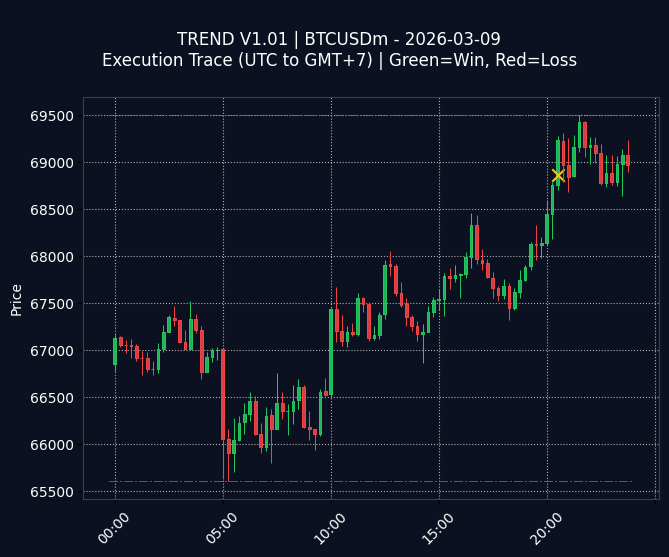
Fig 1. Execution Trace (GMT+7)
Green Line (Win) | Red Line (Loss)
STATS FOR 2026-03-09:
$-10.00
| Trades: 1
$-10.00
| Trades: 1
TREND V1.01 performance for 2026-03-09 resulted in a net loss of $-10.00, derived from a single losing trade. The visual trace indicates a red (loss) signal. Algorithm is showing potential for improvement.
OPTIMIZATION LOG:
“Explore incorporating dynamic stop-loss adjustments based on volatility to mitigate losses.”
(Logged for weekly review)
“Explore incorporating dynamic stop-loss adjustments based on volatility to mitigate losses.”
(Logged for weekly review)
Win Rate
0.0%
0.0%
Day High (Res)
69,499
69,499
Day Low (Sup)
65,609
65,609
Interested in this strategy? Check out the full capabilities of our Trend Following Crypto Bot on the main site.
!
EDUCATIONAL & RESEARCH PURPOSES ONLY (DEV LOG):
This archive displays raw data from an algorithmic trading experiment. It is NOT a solicitation to invest, financial advice, or a guarantee of future profits. Trading involves high risk. Past performance is not indicative of future results.
This archive displays raw data from an algorithmic trading experiment. It is NOT a solicitation to invest, financial advice, or a guarantee of future profits. Trading involves high risk. Past performance is not indicative of future results.