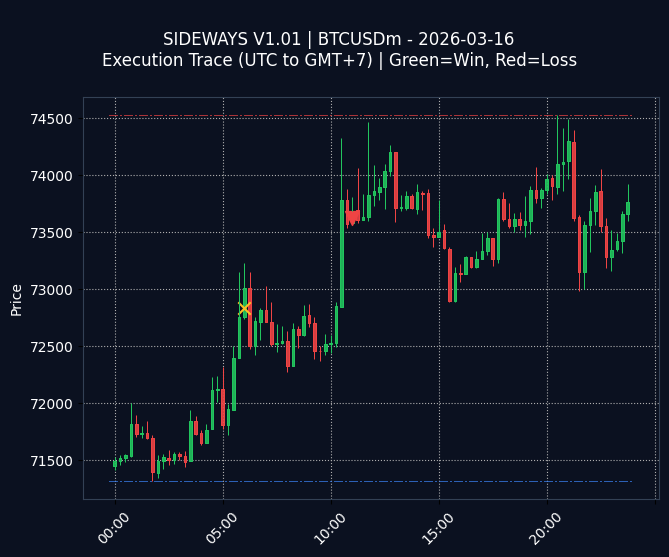
Fig 1. Execution Trace (GMT+7)
Green Line (Win) | Red Line (Loss)
STATS FOR 2026-03-16:
$-20.00
| Trades: 1
$-20.00
| Trades: 1
SIDEWAYS V1.01 (BTCUSDm) Daily Performance Review (2026-03-16): The trading session resulted in a net loss of $20.00, derived from a single losing trade. The visual trace shows one red marker, indicating this loss. Zero winning trades were recorded.
OPTIMIZATION LOG:
“Review stop-loss placement for enhanced risk management, potentially reducing the impact of individual losing trades.”
(Logged for weekly review)
“Review stop-loss placement for enhanced risk management, potentially reducing the impact of individual losing trades.”
(Logged for weekly review)
Win Rate
0.0%
0.0%
Day High (Res)
74,525
74,525
Day Low (Sup)
71,314
71,314
Interested in this strategy? Check out the full capabilities of our Sideways Grid Trading System on the main site.
!
EDUCATIONAL & RESEARCH PURPOSES ONLY (DEV LOG):
This archive displays raw data from an algorithmic trading experiment. It is NOT a solicitation to invest, financial advice, or a guarantee of future profits. Trading involves high risk. Past performance is not indicative of future results.
This archive displays raw data from an algorithmic trading experiment. It is NOT a solicitation to invest, financial advice, or a guarantee of future profits. Trading involves high risk. Past performance is not indicative of future results.