Fig 1. Execution Trace (GMT+7)
Green Line (Win) | Red Line (Loss)
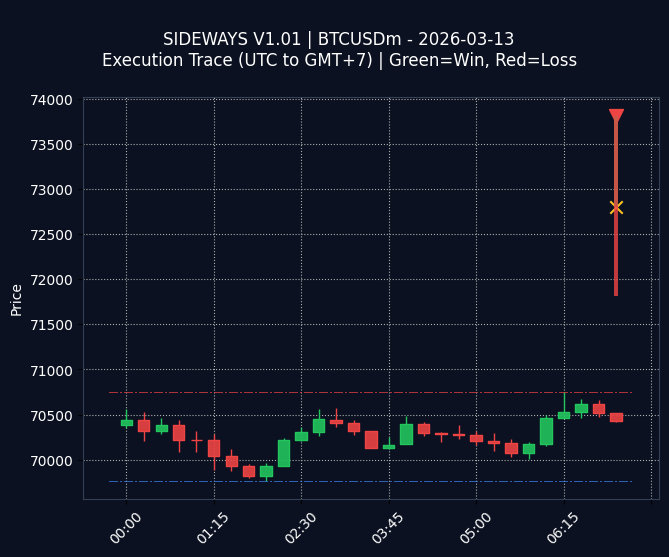
STATS FOR 2026-03-13:
$-20.25
| Trades: 3
$-20.25
| Trades: 3
SIDEWAYS V1.01 (BTCUSDm) – Daily Performance Review (2026-03-13)
The trading session resulted in a net loss of $-20.25 across 3 trades, with a single winning trade. This indicates a challenging day for the algorithm.
Reviewing the visual trace, the single green trace signifies the winning trade, while the two red traces represent losing trades. The losses appear to have outweighed the gains from the winning trade.
OPTIMIZATION LOG:
“Optimize stop-loss placement to reduce the impact of losing trades, potentially using dynamic stop-loss adjustments based on volatility.”
(Logged for weekly review)
“Optimize stop-loss placement to reduce the impact of losing trades, potentially using dynamic stop-loss adjustments based on volatility.”
(Logged for weekly review)
Win Rate
33.3%
33.3%
Day High (Res)
70,753
70,753
Day Low (Sup)
69,764
69,764
Interested in this strategy? Check out the full capabilities of our Sideways Grid Trading System on the main site.
!
EDUCATIONAL & RESEARCH PURPOSES ONLY (DEV LOG):
This archive displays raw data from an algorithmic trading experiment. It is NOT a solicitation to invest, financial advice, or a guarantee of future profits. Trading involves high risk. Past performance is not indicative of future results.
This archive displays raw data from an algorithmic trading experiment. It is NOT a solicitation to invest, financial advice, or a guarantee of future profits. Trading involves high risk. Past performance is not indicative of future results.