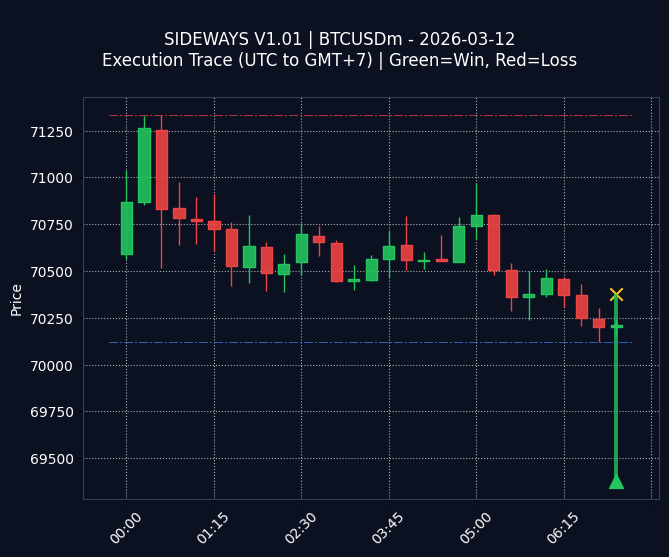
Fig 1. Execution Trace (GMT+7)
Green Line (Win) | Red Line (Loss)
STATS FOR 2026-03-12:
$20.00
| Trades: 1
$20.00
| Trades: 1
SIDEWAYS V1.01 performance on March 12, 2026, resulted in a net profit of $20.00. The trading session comprised of a single winning trade.
The chart displays a solitary green trace, indicative of the successful trade executed during the session.
OPTIMIZATION LOG:
“Explore incorporating a dynamic stop-loss mechanism to better manage risk during periods of high volatility.”
(Logged for weekly review)
“Explore incorporating a dynamic stop-loss mechanism to better manage risk during periods of high volatility.”
(Logged for weekly review)
Win Rate
100.0%
100.0%
Day High (Res)
71,333
71,333
Day Low (Sup)
70,121
70,121
Interested in this strategy? Check out the full capabilities of our Sideways Grid Trading System on the main site.
!
EDUCATIONAL & RESEARCH PURPOSES ONLY (DEV LOG):
This archive displays raw data from an algorithmic trading experiment. It is NOT a solicitation to invest, financial advice, or a guarantee of future profits. Trading involves high risk. Past performance is not indicative of future results.
This archive displays raw data from an algorithmic trading experiment. It is NOT a solicitation to invest, financial advice, or a guarantee of future profits. Trading involves high risk. Past performance is not indicative of future results.