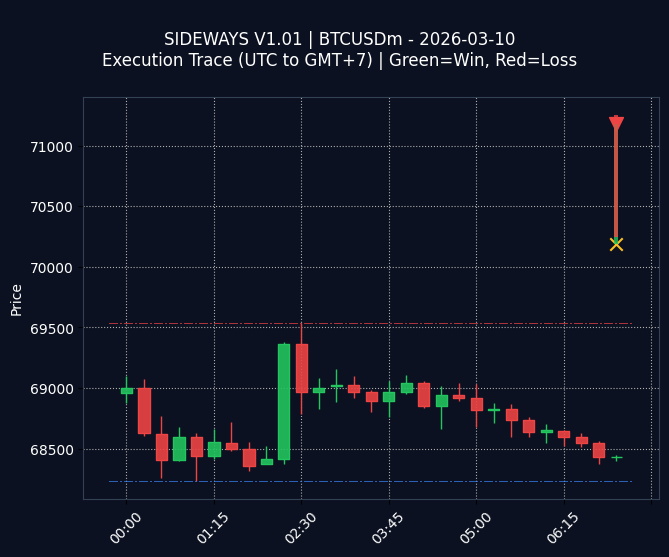
Fig 1. Execution Trace (GMT+7)
Green Line (Win) | Red Line (Loss)
STATS FOR 2026-03-10:
$-20.74
| Trades: 3
$-20.74
| Trades: 3
SIDEWAYS V1.01 (BTCUSDm) – Daily Performance Review (2026-03-10)
The algorithm concluded the trading day with a net loss of $-20.74 across 3 trades, with a win rate of 33.3%. The P/L indicates a slight underperformance, needing a closer look to assess causes.
Chart Commentary: The visual trace reveals a mix of outcomes. The single green segment signifies a successful trade, while the two red segments represent losing trades, contributing to the overall negative P/L. Need to examine conditions around losses.
OPTIMIZATION LOG:
“Refine stop-loss parameters to mitigate potential losses during volatile market conditions, and re-evaluate entry criteria.”
(Logged for weekly review)
“Refine stop-loss parameters to mitigate potential losses during volatile market conditions, and re-evaluate entry criteria.”
(Logged for weekly review)
Win Rate
33.3%
33.3%
Day High (Res)
69,539
69,539
Day Low (Sup)
68,233
68,233
Interested in this strategy? Check out the full capabilities of our Sideways Grid Trading System on the main site.
!
EDUCATIONAL & RESEARCH PURPOSES ONLY (DEV LOG):
This archive displays raw data from an algorithmic trading experiment. It is NOT a solicitation to invest, financial advice, or a guarantee of future profits. Trading involves high risk. Past performance is not indicative of future results.
This archive displays raw data from an algorithmic trading experiment. It is NOT a solicitation to invest, financial advice, or a guarantee of future profits. Trading involves high risk. Past performance is not indicative of future results.