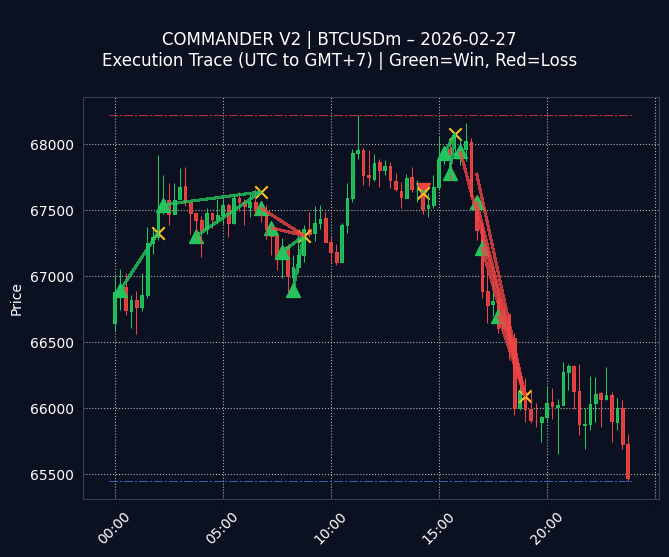
Fig 1. Execution Trace (GMT+7)
Green Line (Win) | Red Line (Loss)
📊 STATS FOR 2026-02-27:
$-186.46
| Trades: 15
$-186.46
| Trades: 15
Daily Performance Review – COMMANDER V2 (BTCUSDm) – 2026-02-27
The trading session resulted in a net loss of $-186.46 across 15 trades, with a win rate of 53% (8 wins). The P/L indicates underperformance today.
Examining the trading chart, the sequence of red (loss) and green (win) traces suggests inconsistent trade outcomes. There’s no clear clustering of wins, which might indicate a lack of a consistent edge during this specific session. More specifically, visual inspection highlights a series of small wins failing to offset larger individual losses, ultimately leading to negative performance.
🔧 OPTIMIZATION LOG:
“Implement a dynamic stop-loss adjustment based on volatility to mitigate losses during periods of increased market fluctuation.”
(Logged for weekly review)
“Implement a dynamic stop-loss adjustment based on volatility to mitigate losses during periods of increased market fluctuation.”
(Logged for weekly review)
Win Rate
53.3%
53.3%
Day High (Res)
68,218
68,218
Day Low (Sup)
65,445
65,445
Interested in this strategy? Check out the full capabilities of our Hybrid AI Trading Bot on the main site.
⚠️
EDUCATIONAL & RESEARCH PURPOSES ONLY (DEV LOG):
This archive displays raw data from an algorithmic trading experiment. It is NOT a solicitation to invest, financial advice, or a guarantee of future profits. Trading involves high risk. Past performance is not indicative of future results.
This archive displays raw data from an algorithmic trading experiment. It is NOT a solicitation to invest, financial advice, or a guarantee of future profits. Trading involves high risk. Past performance is not indicative of future results.