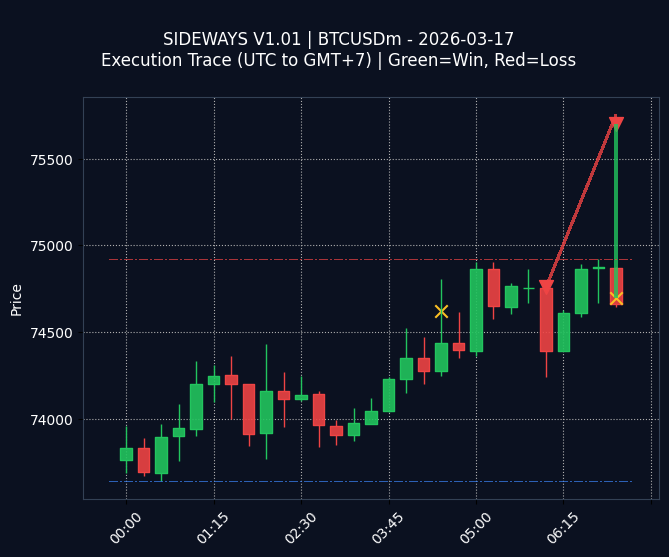
Fig 1. Execution Trace (GMT+7)
Green Line (Win) | Red Line (Loss)
STATS FOR 2026-03-17:
$-19.88
| Trades: 3
$-19.88
| Trades: 3
SIDEWAYS V1.01’s performance on 2026-03-17 resulted in a net loss of $-19.88 across three trades, with one profitable trade. The visual trace indicates a struggle to capture consistent gains. The session highlights the need to reassess entry and exit points given the market conditions.
OPTIMIZATION LOG:
“Refine stop-loss parameters to minimize losses during choppy market conditions, potentially using dynamic stop-loss adjustments based on volatility.”
(Logged for weekly review)
“Refine stop-loss parameters to minimize losses during choppy market conditions, potentially using dynamic stop-loss adjustments based on volatility.”
(Logged for weekly review)
Win Rate
33.3%
33.3%
Day High (Res)
74,921
74,921
Day Low (Sup)
73,641
73,641
Interested in this strategy? Check out the full capabilities of our Sideways Grid Trading System on the main site.
!
EDUCATIONAL & RESEARCH PURPOSES ONLY (DEV LOG):
This archive displays raw data from an algorithmic trading experiment. It is NOT a solicitation to invest, financial advice, or a guarantee of future profits. Trading involves high risk. Past performance is not indicative of future results.
This archive displays raw data from an algorithmic trading experiment. It is NOT a solicitation to invest, financial advice, or a guarantee of future profits. Trading involves high risk. Past performance is not indicative of future results.