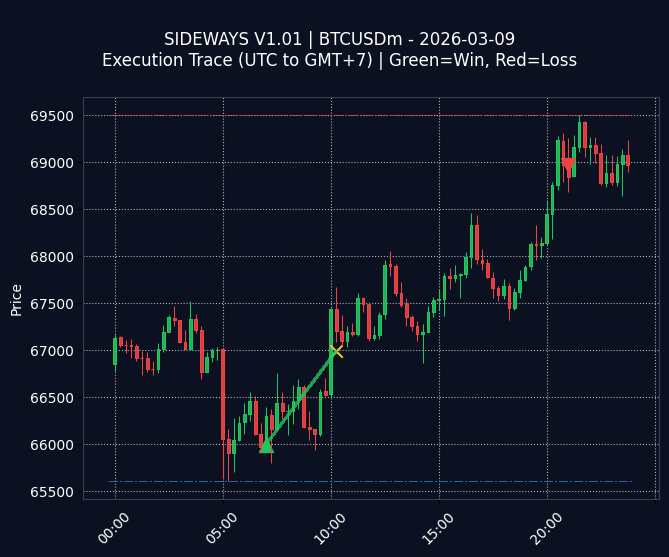
Fig 1. Execution Trace (GMT+7)
Green Line (Win) | Red Line (Loss)
STATS FOR 2026-03-09:
$19.87
| Trades: 1
$19.87
| Trades: 1
Daily Performance Review – SIDEWAYS V1.01 (2026-03-09)
Net Profit: $19.87
Total Trades: 1 (Wins: 1)
Performance Analysis: Today’s session resulted in a small profit, derived from a single winning trade. This indicates a very quiet day for SIDEWAYS V1.01.
Chart Commentary: The visual trace shows a single green entry, signaling a successful trade execution.
OPTIMIZATION LOG:
“Explore implementing a more aggressive position sizing strategy when high-probability setups are identified to potentially maximize profits.”
(Logged for weekly review)
“Explore implementing a more aggressive position sizing strategy when high-probability setups are identified to potentially maximize profits.”
(Logged for weekly review)
Win Rate
100.0%
100.0%
Day High (Res)
69,499
69,499
Day Low (Sup)
65,609
65,609
Interested in this strategy? Check out the full capabilities of our Sideways Grid Trading System on the main site.
!
EDUCATIONAL & RESEARCH PURPOSES ONLY (DEV LOG):
This archive displays raw data from an algorithmic trading experiment. It is NOT a solicitation to invest, financial advice, or a guarantee of future profits. Trading involves high risk. Past performance is not indicative of future results.
This archive displays raw data from an algorithmic trading experiment. It is NOT a solicitation to invest, financial advice, or a guarantee of future profits. Trading involves high risk. Past performance is not indicative of future results.