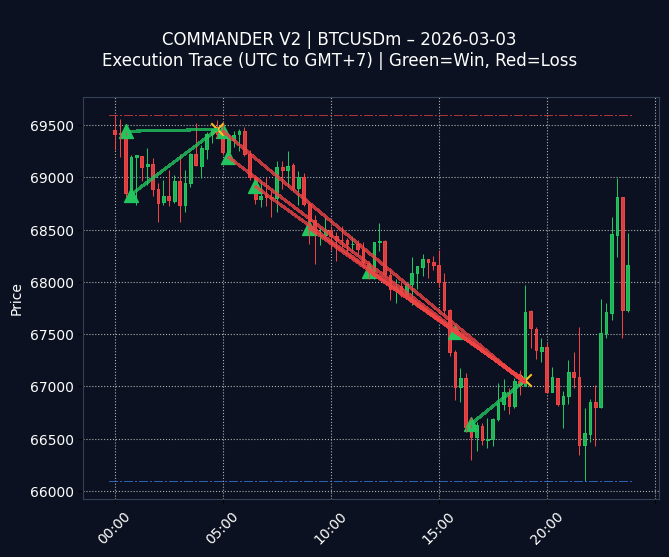
Fig 1. Execution Trace (GMT+7)
Green Line (Win) | Red Line (Loss)
📊 STATS FOR 2026-03-03:
$-330.37
| Trades: 9
$-330.37
| Trades: 9
COMMANDER V2 (BTCUSDm) – Daily Performance Review (2026-03-03)
Today’s session resulted in a net loss of $-330.37 across 9 trades, with a win rate of 33.3% (3 wins). The P/L indicates a challenging day for the algorithm.
Reviewing the visual trade trace, the prevalence of red (losses) suggests a potential issue with trade entry and exit points given current market conditions. Specifically, clusters of small losses might indicate premature exits or stop-loss triggers. Deeper analysis is needed.
🔧 OPTIMIZATION LOG:
“Optimize stop-loss placement by incorporating dynamic volatility metrics to reduce premature stop-outs during periods of high market fluctuation.”
(Logged for weekly review)
“Optimize stop-loss placement by incorporating dynamic volatility metrics to reduce premature stop-outs during periods of high market fluctuation.”
(Logged for weekly review)
Win Rate
33.3%
33.3%
Day High (Res)
69,597
69,597
Day Low (Sup)
66,095
66,095
Interested in this strategy? Check out the full capabilities of our Hybrid AI Trading Bot on the main site.
⚠️
EDUCATIONAL & RESEARCH PURPOSES ONLY (DEV LOG):
This archive displays raw data from an algorithmic trading experiment. It is NOT a solicitation to invest, financial advice, or a guarantee of future profits. Trading involves high risk. Past performance is not indicative of future results.
This archive displays raw data from an algorithmic trading experiment. It is NOT a solicitation to invest, financial advice, or a guarantee of future profits. Trading involves high risk. Past performance is not indicative of future results.