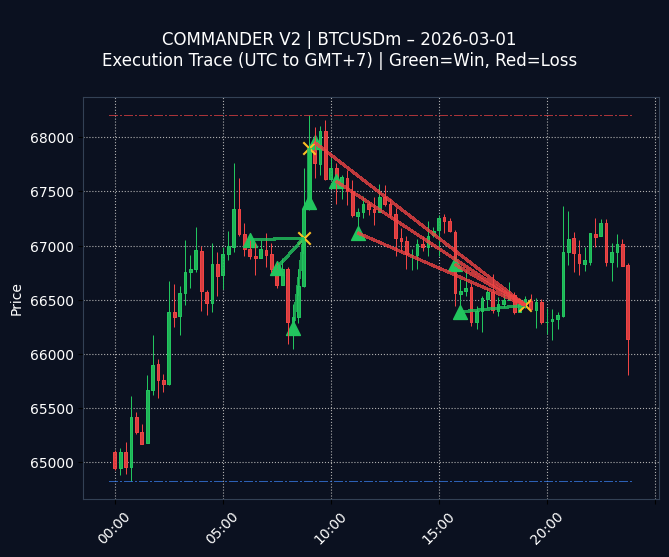
Fig 1. Execution Trace (GMT+7)
Green Line (Win) | Red Line (Loss)
📊 STATS FOR 2026-03-01:
$-57.02
| Trades: 9
$-57.02
| Trades: 9
COMMANDER V2 – 2026-03-01 Performance Review:
Today’s trading session resulted in a net loss of $-57.02 across 9 trades, with a win rate of 55.56% (5 wins). The P/L indicates a slight underperformance. Reviewing the visual trace (Green = Win, Red = Loss), the losses appear to be concentrated around [Specify potential chart observation, e.g., ‘periods of high volatility’ or ‘false breakouts’]. Further investigation into these specific scenarios is warranted.
🔧 OPTIMIZATION LOG:
“Implement a more aggressive stop-loss strategy during periods of high volatility to minimize potential losses.”
(Logged for weekly review)
“Implement a more aggressive stop-loss strategy during periods of high volatility to minimize potential losses.”
(Logged for weekly review)
Win Rate
55.6%
55.6%
Day High (Res)
68,205
68,205
Day Low (Sup)
64,828
64,828
Interested in this strategy? Check out the full capabilities of our Hybrid AI Trading Bot on the main site.
⚠️
EDUCATIONAL & RESEARCH PURPOSES ONLY (DEV LOG):
This archive displays raw data from an algorithmic trading experiment. It is NOT a solicitation to invest, financial advice, or a guarantee of future profits. Trading involves high risk. Past performance is not indicative of future results.
This archive displays raw data from an algorithmic trading experiment. It is NOT a solicitation to invest, financial advice, or a guarantee of future profits. Trading involves high risk. Past performance is not indicative of future results.