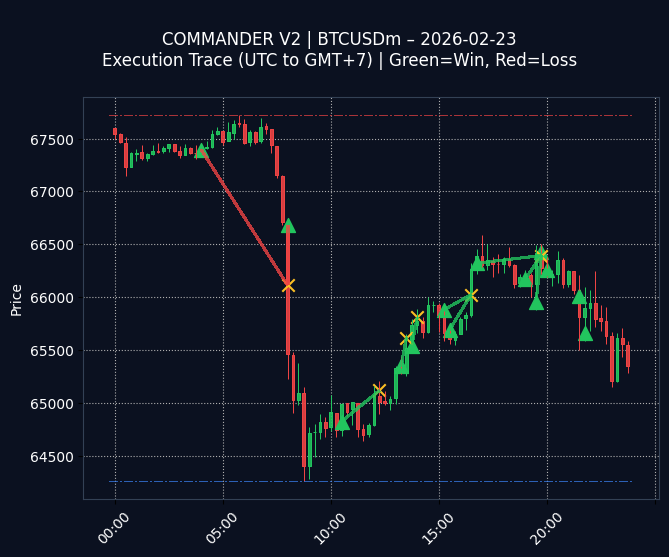
Fig 1. Execution Trace (GMT+7)
Green Line (Win) | Red Line (Loss)
📊 STATS FOR 2026-02-23:
$-4,214.58
| Trades: 16
$-4,214.58
| Trades: 16
COMMANDER V2 (BTCUSDm) – Daily Performance Review (2026-02-23)
The trading session resulted in a net loss of $-4214.58. Sixteen trades were executed, with a win rate of 50% (8 wins).
Chart Commentary: The visual trade trace reveals a mixed pattern of wins and losses. The larger red segments indicate that losses were of greater magnitude than the wins (green segments), contributing to the overall negative P/L.
🔧 OPTIMIZATION LOG:
“Explore tightening stop-loss parameters to minimize the impact of losing trades and improve risk management.”
(Logged for weekly review)
“Explore tightening stop-loss parameters to minimize the impact of losing trades and improve risk management.”
(Logged for weekly review)
Win Rate
50.0%
50.0%
Day High (Res)
67,722
67,722
Day Low (Sup)
64,261
64,261
Interested in this strategy? Check out the full capabilities of our Hybrid AI Trading Bot on the main site.
⚠️
EDUCATIONAL & RESEARCH PURPOSES ONLY (DEV LOG):
This archive displays raw data from an algorithmic trading experiment. It is NOT a solicitation to invest, financial advice, or a guarantee of future profits. Trading involves high risk. Past performance is not indicative of future results.
This archive displays raw data from an algorithmic trading experiment. It is NOT a solicitation to invest, financial advice, or a guarantee of future profits. Trading involves high risk. Past performance is not indicative of future results.